
Everyone is going to play this rebound wrong.
The sentiment gauge says the crowd is euphoric. Here's the three-part framework I use when that happens — and why this reading is a weirder one than most.

The S&P 500 cleared 7,000 for the first time ever last week. The Mag 7 posted its best week since 2023. The Nasdaq ran its longest winning streak since 1992. Needless to say, this has been a rally for the books — a textbook V-shaped recovery.
Matching it was a sudden shift from “extreme fear” to “greed” on CNN’s Fear & Greed Index. Every other financial publication wrote about the recovery, the index flipping, what it all means.
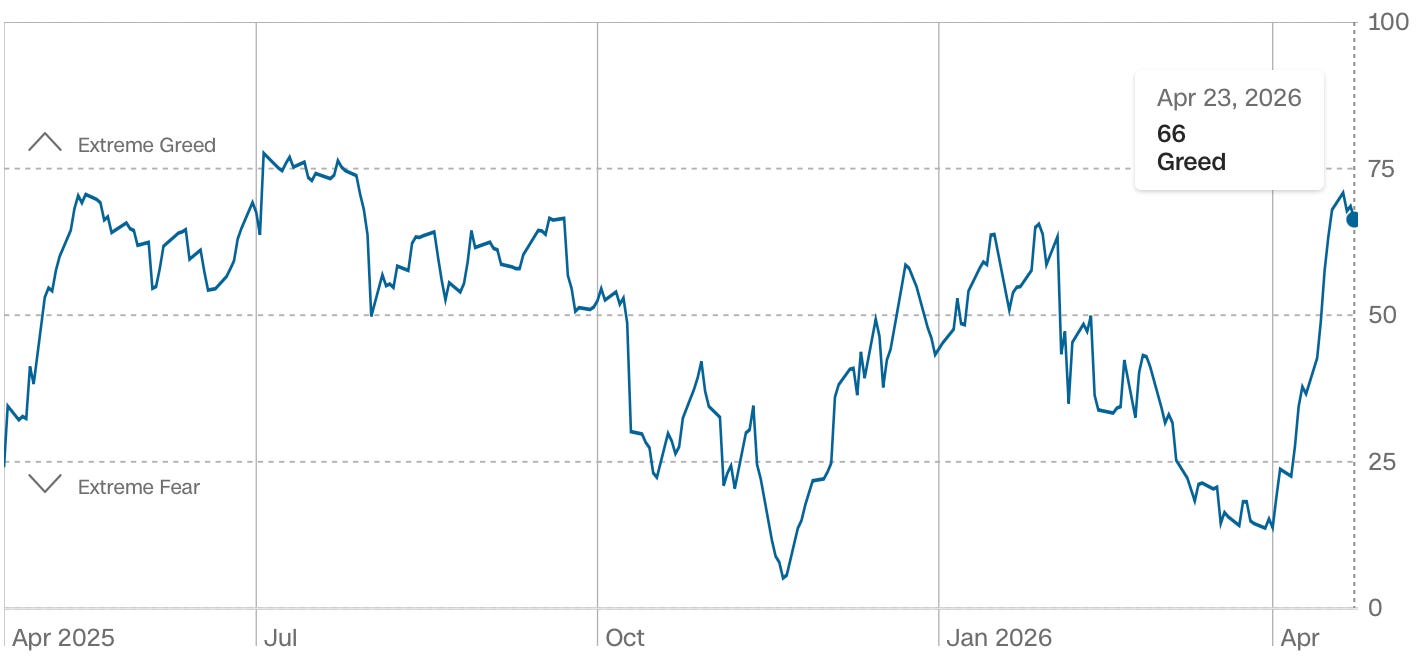
I already broke down the Fear & Greed Index in a previous article. Today I want to talk about what to actually do when it flashes a reading like this one. It’s more complicated than “a good time to sell” or whatever headline you may have seen — so let’s break it down.
By the end of this article, you’ll have a full understanding of what trading and investing should look like right after a historic rebound.
This Is Unusual Greed
To quote myself in a previous article:
Most investors think the market waits for good news before it rebounds. It doesn’t. The market begins its rally when things go from “dumpster fire” to “slightly less bad.” You don’t need an all-clear signal. By the time you get one, the move already happened.
Historically, I'm not far off. That's why this recovery is the exception, not the standard. So what made this rebound so sharp, and what makes it so unusual? The catalysts were dirty. Let's go through them.
Ceasefire between Israel and Lebanon - Good signal, except already broken at the time of writing. Tensions re-escalated.
Iran declaring the Strait of Hormuz “completely open” - Positive for every sector except oil, but Trump says the naval blockade stays in effect. Both can’t be true.
Great earnings season (~86% of S&P beating per FactSet) - Always a positive sign. Businesses are thriving despite shaky macro headwinds.
S&P claiming and clearing 7,000 - Very positive, but historically all-time highs are followed by a slight downturn.
The overarching contradiction I hope you picked up on: investors are reading everything as a euphoric win while the underlying setup is fragile at best. But I don’t need to tell you that. Look at the price of gas. Turn on the news for five minutes. Scroll Trump’s posts from the past few days. This isn’t political — it’s unbiasedly a macroeconomic house of cards. Look at the 6-month charts of oil, silver, gold, and the indexes, and you’ll see the market agrees with me.
The difference is that the market keeps rallying despite all the resistance it should be facing. The mismatch between sentiment and setup is what makes this reading worth thinking about, instead of dismissing it or panicking over it.
Before I dive into what to do, I want to go over something I failed to mention in my previous fear and greed article.
Greed Does NOT Mean Sell
Extreme fear is historically the best buy signal you could ask for. But this doesn’t work in reverse. Don’t plan to sell everything in extreme greed — you’ll likely watch the market rally even more and hear me say “I told you so.” The Fear & Greed Index is asymmetric.
Historically, markets can sit in greed or even extreme greed for weeks or months while continuing higher — case in point, both 2023 and 2024. Meanwhile, an extreme fear signal below 10 almost always marks the bottom nearly perfectly. Forward 1-month S&P returns from greed readings have been roughly in line with average returns.
In reality, greed is a yellow flag — not a red or green one. It should make you pay closer attention, not ring a bell. Selling into greed is far worse than buying into fear. Missed gains cost more than unrealized losses. You need a process for this awkward timing, not a panic strategy.

But if selling isn’t the right response, what is? Here’s what I do.
3 Things I Do When the Index Flips Green
Re-read the thesis on every holding. This assumes you're journaling your trades — which most of you reading probably aren't. Pull up your notes on every position, re-read the thought process behind the buy, and ask yourself: if you didn't already own it, would today's price still be an appetizing entry? If you can't answer yes confidently — because the thesis was carried by price or a weak catalyst — this is as green as the stock should get. I did exactly this in my last Behind the Curtain issue, showing holdings that had rallied and still had legs, plus one laggard I was still confident in and defended. All of them are up +5% since I wrote it.
Treat greed as a position-sizing input. Greed brings out fake hope in positions, often inflating our sense of correctness and our egos. Instead of letting it get to you, let greed be a reason to leg into positions rather than going all-in. This isn't an advertisement for DCA. It's simply widening your entry band, shortening your purchase size, and leaving ammo for a possible pullback. You're acknowledging that odds of a short-term pullback are higher when sentiment is hot — and reflecting that in your cost basis. It's not timing the market. It's assuming the market isn't going up forever and proving you're prepared. Delayed action isn't weakness to the smart investor; it's the same discipline that makes them rich.
Stress-test the plan you have. Again, this assumes you have an entry/exit strategy, risk management, and so on — which most of you reading likely don't. Pull the journal back out one last time. What are you doing if there's a 10% pullback in any of your positions? The indicator isn't pointing at a market problem; it's pointing at a you problem. Which positions do you want to add to? Which do you trim? What's the floor for each individual position? There are countless questions you can ask that will annoy you now but save you a lot of money later — or make you even more. Greed is a gift when you answer these questions before a pullback. Don't wait for one and rely on hope.
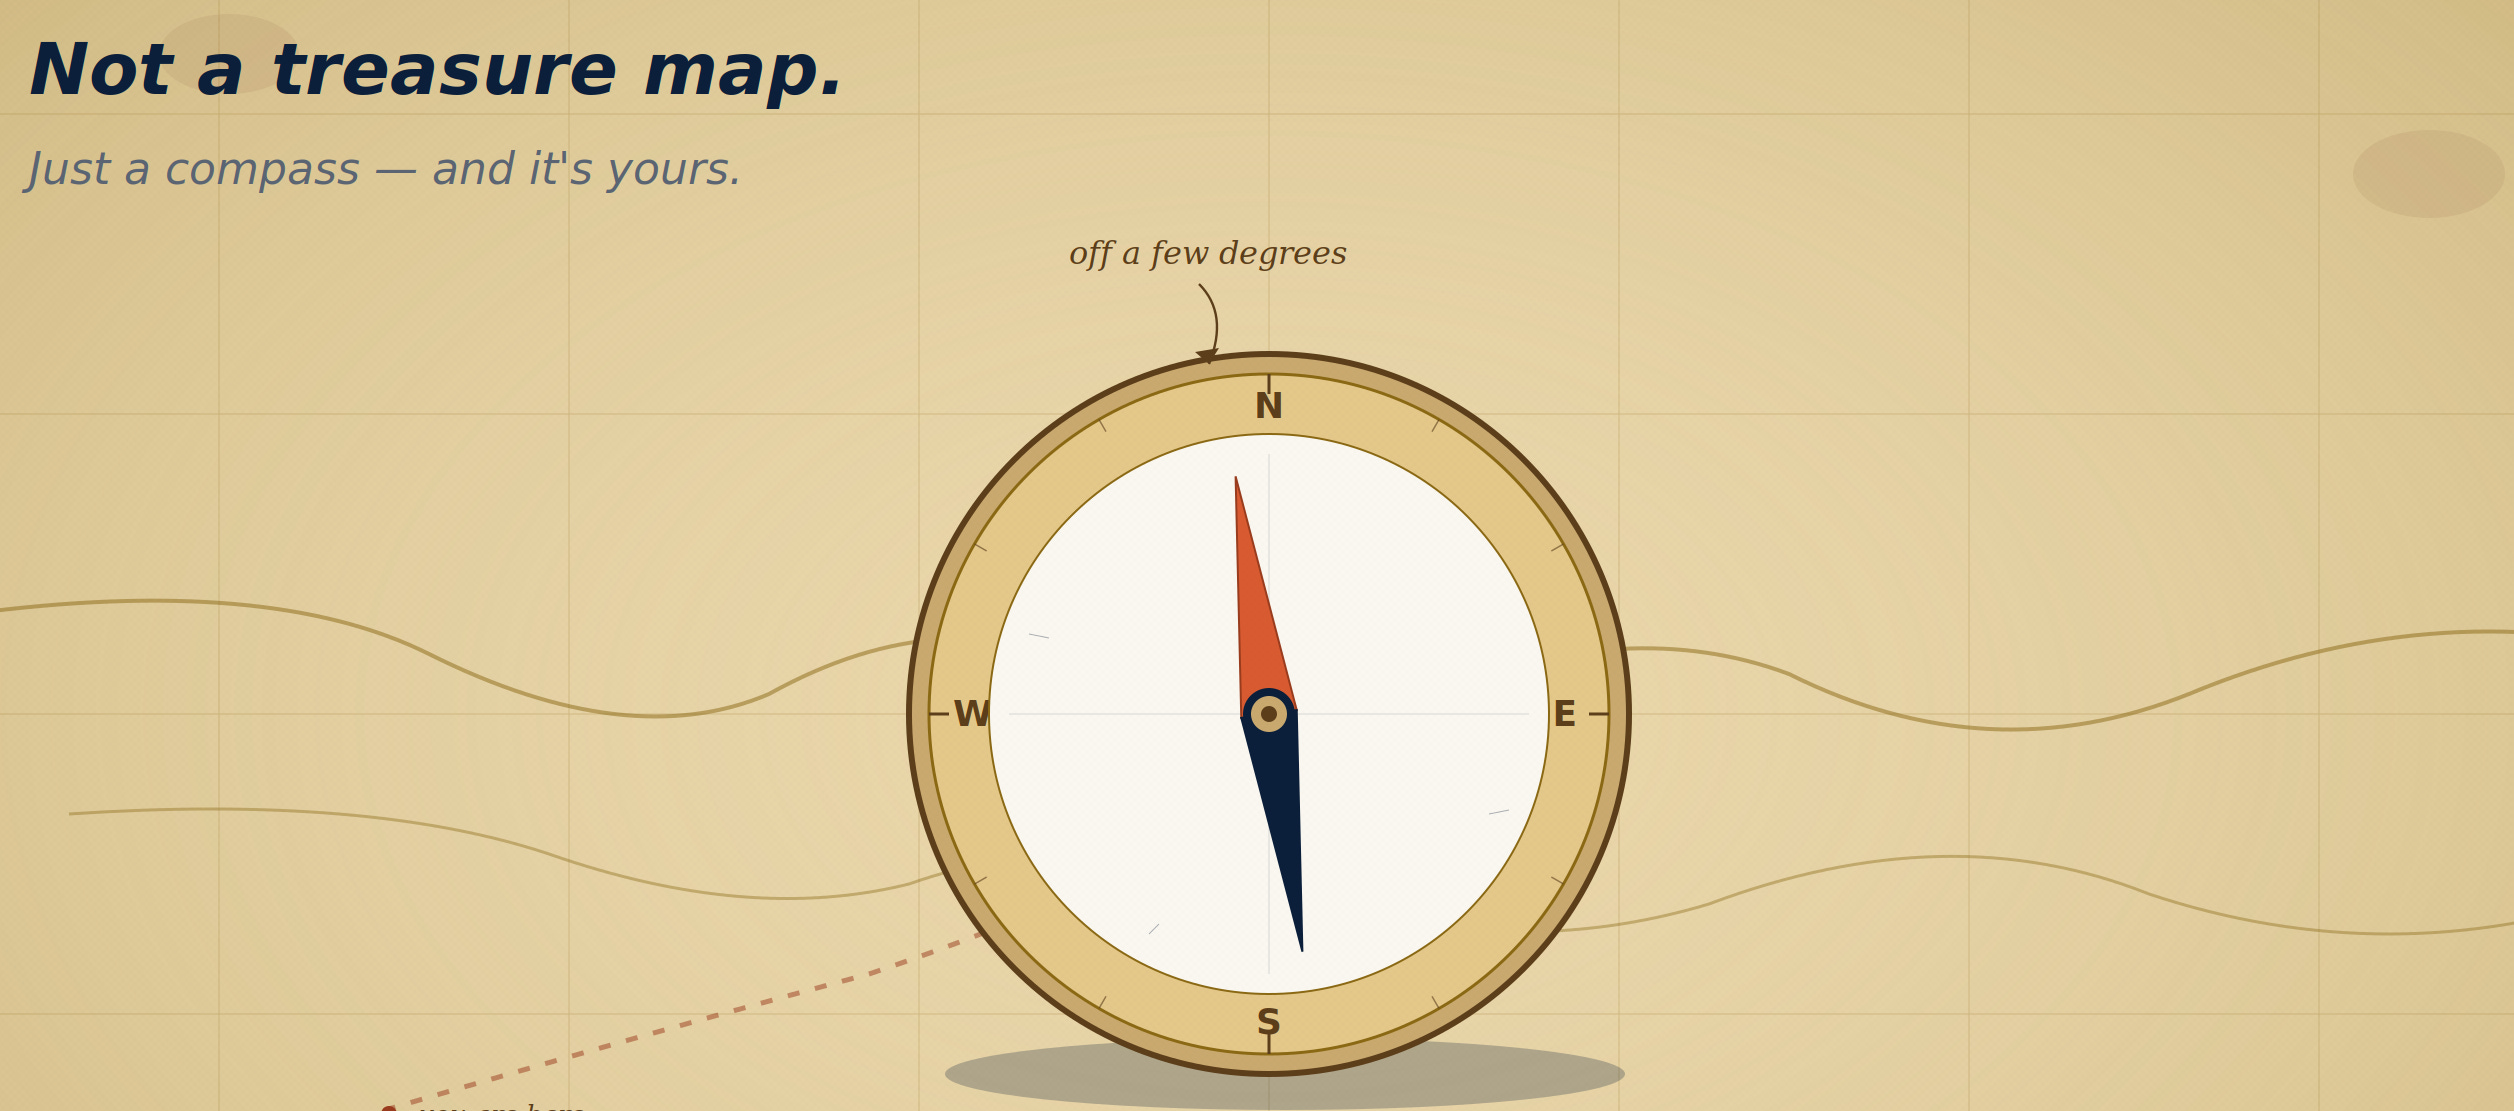
The Work Isn’t the Indicator’s Job
People look at the Fear & Greed Index like it’s a map with an X marking the treasure. It’s more like a homemade compass that’s off a few degrees — it won’t tell you where the market is going, but it can point you toward the crowd.
The real question is what work you do with what the Fear & Greed Index shows you. If you look at tools like this with an approving nod and a “that’s cool,” you might as well not look at them at all.
Within the next week, I’m running my full framework on a stock I’m actively considering adding to. I’ll be publishing the full checklist — 4 more points, 7 specific checks total — for adding into greed territory, along with how that stock scores on each one. Paid subscribers only. Coming soon.